I’ll be honest, I’m never sure if sharing a post of reading statistics is interesting to anyone but me. But since I find them endlessly fascinating, and this is my blog, you’ll have to indulge me for this post!
One of the reasons I like doing statistics posts like this one is that I often find that my impressions of my reading — what kinds of books I read, what types of books I was reading — are often very different than what I actually read. I often overestimate the amount of fiction I read and while underestimating the number of review copies, for example. It’s interesting for me to look closely at all of the information I gather about the books I’ve read and see what it can tell me about my reading life.
The Basics
- 110 books read (109 in 2011)
- 34,883 pages read (34,127 in 2011)
- 93.5 hours listened (58 in 2011)
- 671 pages per week (656 in 2011)
- 96 pages per day (93.5 in 2011)
Longest Book: A Clash of Kings by George R.R. Martin (873 pages). Interestingly, my longest book of 2011 was also by Martin (A Game of Thrones). Will my longest book of 2013 be another Martin book, A Storm of Swords (1,008 pages)?
Shortest Book: The Influencing Machine by Brooke Gladstone (181 pages)
Most Common Book Length: 288 pages (8 books)
Oldest Book: The Great Gatsby by F. Scott Fitzgerald (1925)
Books Published in 2012: 52 of 110 (47 percent)
Most Frequent Publisher: Crown (9 books)
Author Gender: 56 female authors, 51 male authors
Books by Genre
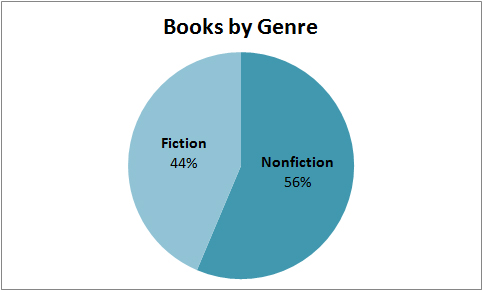
And now my favorite part of any book stats post, the charts! This first one shows a breakdown of my fiction versus nonfiction reading. Of the 110 books I read this year, 62 were nonfiction (56 percent) and 48 were fiction (44 percent).
In 2011, I read 64 percent nonfiction and 36 percent fiction, so it looks like this year my amount of nonfiction went down just a little bit. I think, perhaps, that is because I had quicker access to more popular fiction from my local library, so I read more of the big fiction books from the year.
Books by Acquisition Type
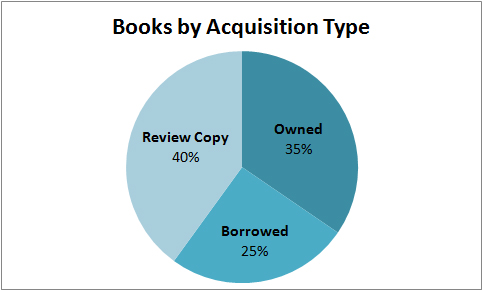
This is always one of my favorite charts because it lets me know how I did on one of my goals – to balance reading my own books versus review copies and borrowed books. Of the 110 books I read, 38 were my own, 28 were borrowed, and 44 were review copies.
This makes me so happy because my goal for 2012 was 40 percent review copies, 30 percent library books, and 30 percent personal books. I was almost perfect!
Books by Format
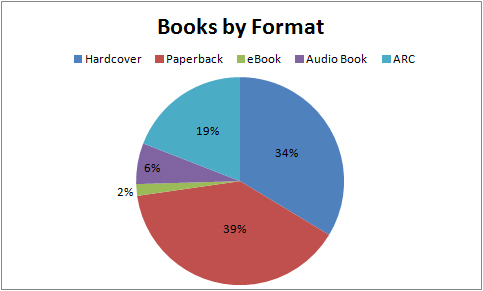
One of the other things I keep track of is what format I read books in. As you can see, despite having an ereader and joining Audible, I still read comparably few ebooks (2 books) and audio books (7 books). In the past, this breakdown has mostly been just out of curiosity, but I think I am going to work format into my goals for 2013 since I seem to have the book acquisitions more in control.

So there you have it, a look at my year in books complete with charts! I’m still finalizing my list of goals for 2013, but I’m hoping to have them ready by Sunday. Happy Friday!


Comments on this entry are closed.
Happy new year, Kim! I wondered if it was odd that I had a different idea of what I’d read than what actually happened, so I’m glad to know I’m not the only one! It’s interesting to see statistics, and visuals are easier to take in and appreciate 🙂
I think we all have some misconceptions about what we think we do versus what we actually do. I know I have them in other aspects of my life not so easily organized by charts 🙂
I love stats – My own and other peoples. Keeps me motivated to beat past year numbers. Which I did not do in 2012…
This was the first year I did the Goodreads challenge, explicitly paying attention to the number of books I read, and I was kind of surprised that it didn’t make me feel competitive. In fact, around October I didn’t think I’d even match 2011 and I was totally fine with it 🙂
I love stats like this! I need to keep better records so I can break down my reading more. Here’s to another terrific year in books!
I only started keeping really good records last year, and decent number the year before. It does make me wish I’d tracked the books I read even earlier.
Great stats — especially love the categories you picked to showcase books: longest, oldest, publisher, gender. Would be interesting to look at my own reading from last year in that light.
Good luck on the format progress! I just got into audio books and read very few of them just because it takes me so long to get through one (average about a month) but would also depend on what time you have to listen to audio.
I think the ebook one will be pretty easy — I just have to make a point to pick up my Nook once in awhile — but I’m not sure about audio books. I only started with Audible in the middle of 2012 and still read seven, so I think 12 will be manageable, but we’ll see.
I love your stats Kim! I keep meaning to do more intricate stats myself and I always run out of time…
It used to take me awhile to do this, but since I started using a Google Form log my books, a number of these stats are calculated automatically. I just make the pie charts, which doesn’t take too long.
I’m interested to see that you read so few e-books actually, for some reason I assumed you read far more. I don’t have an e-reader but occasionally read books on my laptop via NetGalley, though I admit I prefer ‘thingy’ books better!
I was surprised by that one too, actually. I knew I didn’t read many ebooks, but I really didn’t know it was that few. I still prefer ‘thingy’ books myself, but I think a shift to ebooks is a good direction for me (even if it’s just a tiny, tiny shift).
Who doesn’t love stats, especially when accompanied by pie charts! I’m pretty impressed by how similar your numbers were in 2011 and 2012.
They’re eerily similar… I don’t know what that’s about!
I do love stats by other bloggers, that gives me ideas to do my own, and to catch on some titles I may have missed. here is my wrap-up, with pies and charts: http://wordsandpeace.com/2013/01/03/year-of-reading-2012/.
so thanks for sharing yours with us all.
I like seeing other stats posts too; it’s fun to think about tracking different things.
Yay charts! I didn’t think of tracking publishers. Hmm…. might have to add another column to my 2013 spreadsheet. 😉
I don’t pay a lot of attention to that one, but it was interesting to go back and look at them. I was pretty equal among certain imprints of the Big Six publishers (Harper was pretty popular too).
I love this post! I’d love to keep such close track of my reading this year, how do you do it?? 🙂
I use a Google Form. I used to just enter into a spreadsheet, but when I switched to the form (which was initially just because it was pleasing to look at), I discovered that the Form will actually calculate some answers for you. I sent you an e-mail about this, so let me know if you need more info!
I’m trying to play with my stats to make pretty charts, too! LOVELY. Congrats on a great reading year and wishing you the best of reading in 2013.
Thanks Care, I can’t wait to see your stats (especially since I know there will be some pie charts!).
Pie charts!
I like the stats. I always vow to keep stats and it never happens. Yours are interesting to read.
It took me awhile to get in the habit of keeping regular stats, but now that I have a system I like (a Google Form), it’s gotten easier.