Happy October! I can’t believe that the year is 75 percent over already… it’s flying by. Since I haven’t done a bookish stats post in a long time (maybe as far back as the end of 2011), so I decided today would be as good a day as any to check in.
So far this year I’ve finished 89 books. As of this time last year, I’d read 80 books, so I’m still reading faster than I was last year, even if September was a little bit slow. Those 80 books add up to 27,979 pages and about 88 hours in audio books. That’s a lot of reading!
Books by Genre
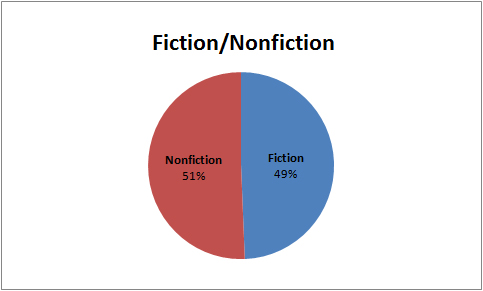
In 2011, I read quite a bit more nonfiction than fiction. So far this year I’m pretty much even between fiction and nonfiction, which is interesting — 39 fiction and 40 nonfiction. I think the nonfiction number will go up by the end of the year, since I have a number of nonfiction review copies I want to finish.

Books by Source
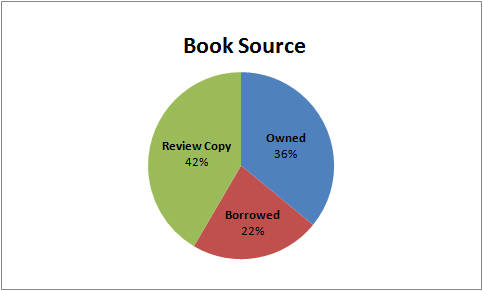
Of all the things I keep track of, where books come from is the important one because I try to balance out review copies, personal books and library books. As the chart shows, I’m doing a pretty good job — 33 of my own books, 20 borrowed books and 37 review copies. I want to read more of my own books through the end of the year, if I can, to even that out.

Books by Format
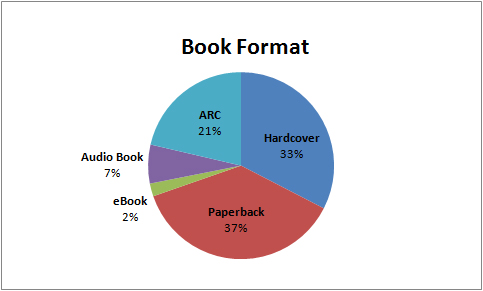
I don’t make any effort to read books in a certain format, but I always find this statistic interesting. I wish I read more ebooks and audio books, but I’m usually happier picking up a paperback.

So there you have it – a look at my reading so far in 2012. For the rest of the year, I hope I can finish several more of my own books and finish a few more of my audio books. What books are you hoping to read in the last few months of the year?

Comments on this entry are closed.
Pie charts! *swoon*
😉
Softdrink cracks me up.
Do call you ack size paperbacks? Just curious, but am also assuming. great stats! 89 books already!
Crapipadediting isfor the birds. Or typing,. Just typing! That ack was supposed to be TRADEBACKs. i only call the small ones paperbacks… I rarely read papeback size books.
I count all of them — trade paperback and mass market paperback — in the paperback section. I don’t actually read many mass market paperbacks (I don’t like the size), so I think that’s mostly trade paperback anyway.
Oooh ooh I love charts! Nice!
89? Wow — seems like you’re right up there with the 100 book mark by the end of the year.
I hope so. I’ve been reading more slowly the last couple of months, but I think I should pretty easily hit 100, probably even 110, before the year is done. That is a wow 🙂
This is awesome! I love bookish stats! How did you make your pie charts? They are way cool! 🙂
I did them in Microsoft Excel. I have a Google Doc where I keep track of stats, then I just plug the relevant ones into an Excel spreadsheet to make the pie charts.
“Last few months of the year” = crazy madness. How can it already be the last few months of the year? I should try doing graphs myself, to compare the percentages of ebooks vs physical books since I got my ereader.
Yes… it is crazy. I’d love to see your charts! This is the second year that I’ve kept really detailed book stats, so I’m hoping to do a comparison between 2011 and 2012 at the end of the year to see how things shake out.
I love those pie charts. How did you do them? Did you create them? Did another site create them for you? Inquiring minds want to know….
I can’t believe the year is almost over. When I realized it was October 1, I think I actually gasped…
Microsoft Excel, although there’s probably an easier way to do it. I enter all of my book stats in a Google Form, and with that you can look at a summary of responses that includes some graphs and charts. But I like pie charts, so I end up entering the relevant numbers into an Excel spreadsheet and making them there. It’s actually really easy, if you have Excel.